The Timeline
The following timeline is a compilation of news media from every day of the pandemic.
We also provide a brief analyses for each month of the year, with a general overview of events, trends, and significant policy or ideological shifts.
Our method involved using keywords on search engines throughout each day of the pandemic. Keywords were modified as they fell out of use in their historic context and new ones were adopted (for instance, the disease was called “Wuhan Pneumonia” in January 2020, and evolved to COVID-19 by mid-February).
Media cited is a mix of opinion and standard reporting.
We almost always include the original links directly from articles collected, and all links have been uploaded to the Internet Archive in case the news organization changes a link or removes an article.
We link directly to the Internet Archive in cases where articles have already been removed.
Our goal is to create and maintain a useful tool for researchers, students, policymakers, or anyone who wants to remember what happened in these two years.
Collected links
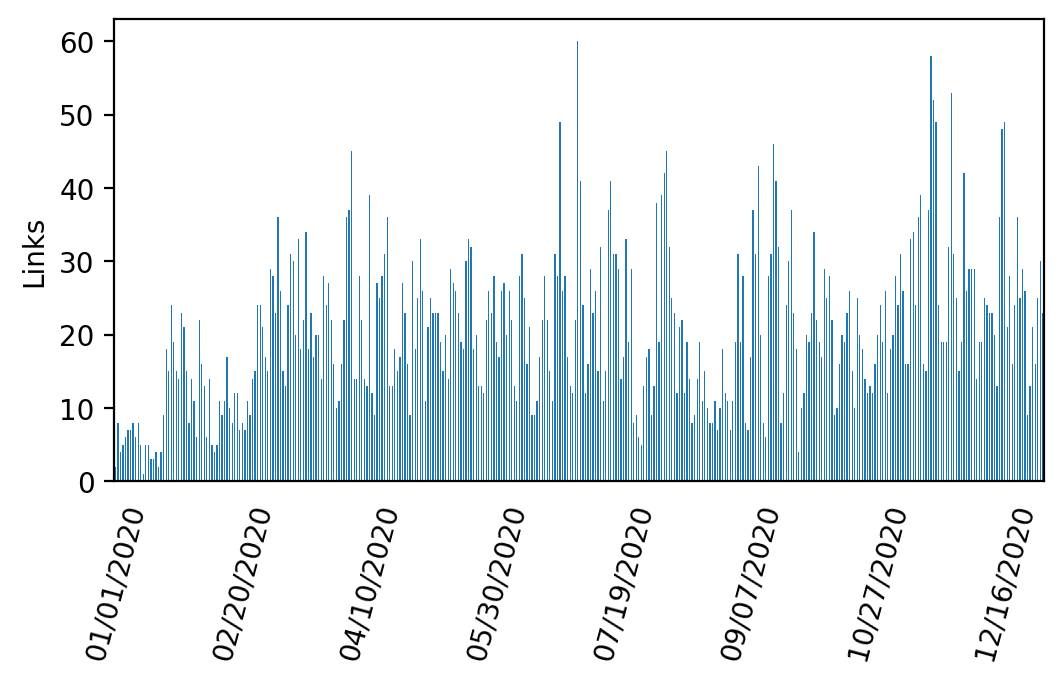
The following graph is presented at the beginning of every month.
While it is not a complete representation of all media published about COVID-19 during this time, it can provide an approximation for the amount of news being produced at the time.